4 Work in progress
As I work through the steps I will add code and notes to this section of the gitbook. The first step I have done is to convert the downloaded my-maps data. To conbvert a my-maps online map into a tidy format we can work in I have done the following.
4.0.1 Static maps
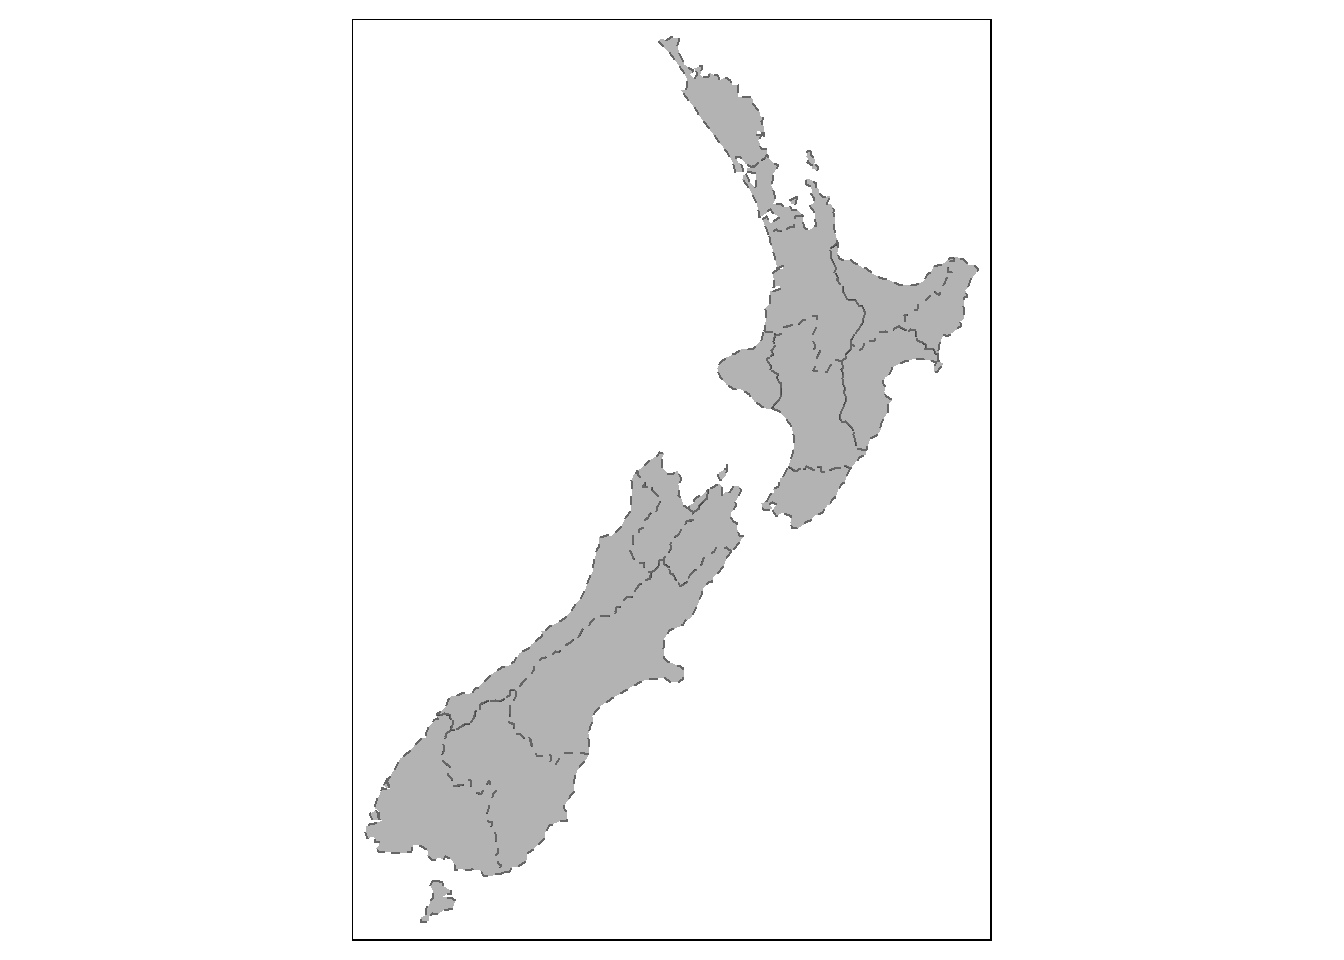
Static maps are the most common type of visual output from geocomputation. Standard formats include .png and .pdf for raster and vector outputs respectively. Initially, static maps were the only type of maps that R could produce. Things advanced with the release of sp (see Pebesma and Bivand 2005) and many techniques for map making have been developed since then. However, despite the innovation of interactive mapping, static plotting was still the emphasis of geographic data visualisation in R a decade later (Cheshire and Lovelace 2015).
The generic plot() function is often the fastest way to create static maps from vector and raster spatial objects (see sections 2.2.3 and 2.3.2). Sometimes, simplicity and speed are priorities, especially during the development phase of a project, and this is where plot() excels. The base R approach is also extensible, with plot() offering dozens of arguments. Another approach is the grid package which allows low level control of static maps, as illustrated in Chapter 14 of Murrell (2016). This section focuses on tmap and emphasizes the important aesthetic and layout options.
tmap is a powerful and flexible map-making package with sensible defaults. It has a concise syntax that allows for the creation of attractive maps with minimal code which will be familiar to ggplot2 users. It also has the unique capability to generate static and interactive maps using the same code via tmap_mode(). Finally, it accepts a wider range of spatial classes (including raster objects) than alternatives such as ggplot2 (see the vignettes tmap-getstarted and tmap-changes-v2, as well as Tennekes (2018), for further documentation).
- Download the
kmzfile from online.
A KMZ file is just a zipped KML file, possibly with associated embedded images, icons, etc.
So any program that supports KMZ files internally unzips them to access their KML files. That may be a reason why many open source programs do not bother supporting KMZ once KML support is implemented: you just need to use an additional unzipping library of your choice, to convert the KMZ to KML. The linked posts give some JavaScript-based solutions for unzipping.
exdirdefines the directory to extract files to. It will be created if not already available. If you don’t setexdir,unzipwill just unzip it to your current working directory.
## Google's Terms of Service: https://cloud.google.com/maps-platform/terms/.## Please cite ggmap if you use it! See citation("ggmap") for details.4.1 My notes
These resources are very basic but they may be helpful for me later.
- Found in stack comments here
##
## Attaching package: 'kableExtra'
## The following object is masked from 'package:dplyr':
##
## group_rows| folder | name | description | styleUrl | longitude | latitude | altitude |
|---|---|---|---|---|---|---|
| Hollyford | Gunns Camp | NA | #icon-1899-0288D1-nodesc | 168.1392 | -44.76039 | 0 |
| Hollyford | Choqenout and Ruscoe 2000 | Eglinton Valley | #icon-1899-0288D1 | 167.9963 | -45.06019 | 0 |
| Hollyford | Hollyford Valley Lookout | NA | #icon-1899-0288D1-nodesc | 168.1050 | -44.80905 | 0 |
| Hollyford | Hollyford Airstrip | NA | #icon-1899-0288D1-nodesc | 168.1337 | -44.73744 | 0 |
| Hollyford | Point 9 | NA | #icon-1899-0288D1-nodesc | 168.1262 | -44.79766 | 0 |
| Hollyford | Point 10 | x = 10, y = 250 | #icon-1899-0288D1 | 168.0794 | -44.90247 | 0 |
| Eglinton Valley | MR1 | NA | #icon-1899-F9A825-nodesc | 168.0776 | -44.89081 | 0 |
| Eglinton Valley | M1 | NA | #icon-1899-FBC02D-nodesc | 168.1005 | -44.85371 | 0 |
| Eglinton Valley | M1 | NA | #icon-1899-FBC02D-nodesc | 168.0748 | -44.89257 | 0 |
| Eglinton Valley | R1 | NA | #icon-1899-000000-nodesc | 168.0968 | -44.85569 | 0 |
| Eglinton Valley | MR1 | NA | #icon-1899-FBC02D-nodesc | 168.0995 | -44.85768 | 0 |
| Eglinton Valley | R1 | NA | #icon-1899-000000-nodesc | 168.0789 | -44.89277 | 0 |
4.2 Building maps for manuscripts
These starting resources have come from chapter-8 of the geocomp book. To make this quick I have used the rmarkdown function render to create a r file that can then be sourced here for building my data specific maps.
## Legend labels were too wide. The labels have been resized to 0.29, 0.29, 0.29, 0.29, 0.29, 0.29. Increase legend.width (argument of tm_layout) to make the legend wider and therefore the labels larger.## Legend labels were too wide. The labels have been resized to 0.44, 0.29, 0.29. Increase legend.width (argument of tm_layout) to make the legend wider and therefore the labels larger.## Legend labels were too wide. The labels have been resized to 0.29, 0.29, 0.29, 0.29, 0.29, 0.29, 0.29, 0.29, 0.29, 0.29. Increase legend.width (argument of tm_layout) to make the legend wider and therefore the labels larger.## Legend labels were too wide. The labels have been resized to 0.29, 0.29, 0.29, 0.29, 0.29, 0.29. Increase legend.width (argument of tm_layout) to make the legend wider and therefore the labels larger.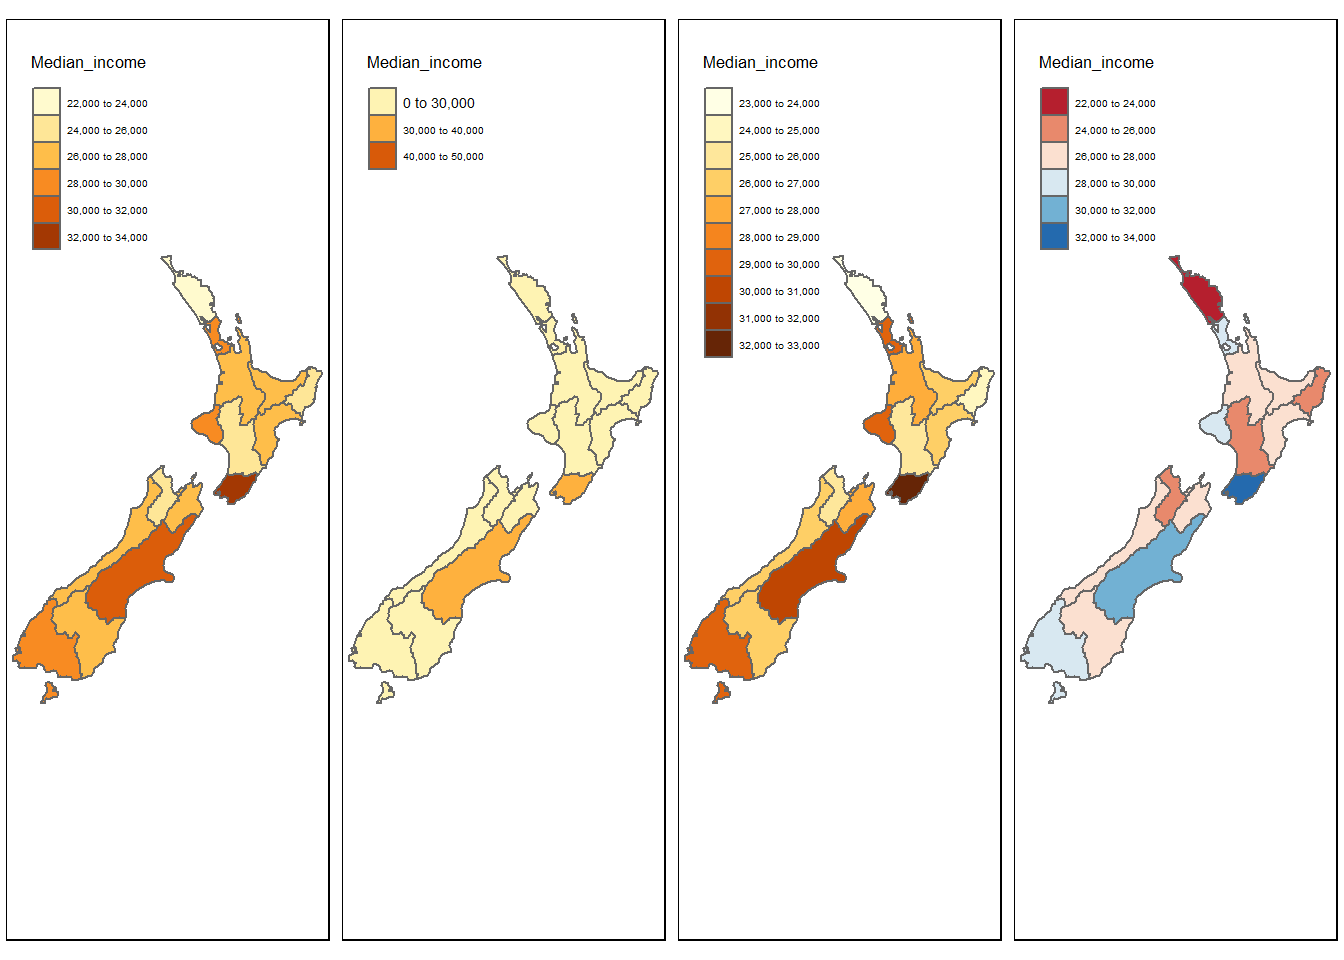
## Legend labels were too wide. The labels have been resized to 0.47, 0.47, 0.47, 0.47, 0.47, 0.47. Increase legend.width (argument of tm_layout) to make the legend wider and therefore the labels larger.## Legend labels were too wide. The labels have been resized to 0.47, 0.47, 0.47, 0.47, 0.47. Increase legend.width (argument of tm_layout) to make the legend wider and therefore the labels larger.
## Legend labels were too wide. The labels have been resized to 0.47, 0.47, 0.47, 0.47, 0.47. Increase legend.width (argument of tm_layout) to make the legend wider and therefore the labels larger.
## Legend labels were too wide. The labels have been resized to 0.47, 0.47, 0.47, 0.47, 0.47. Increase legend.width (argument of tm_layout) to make the legend wider and therefore the labels larger.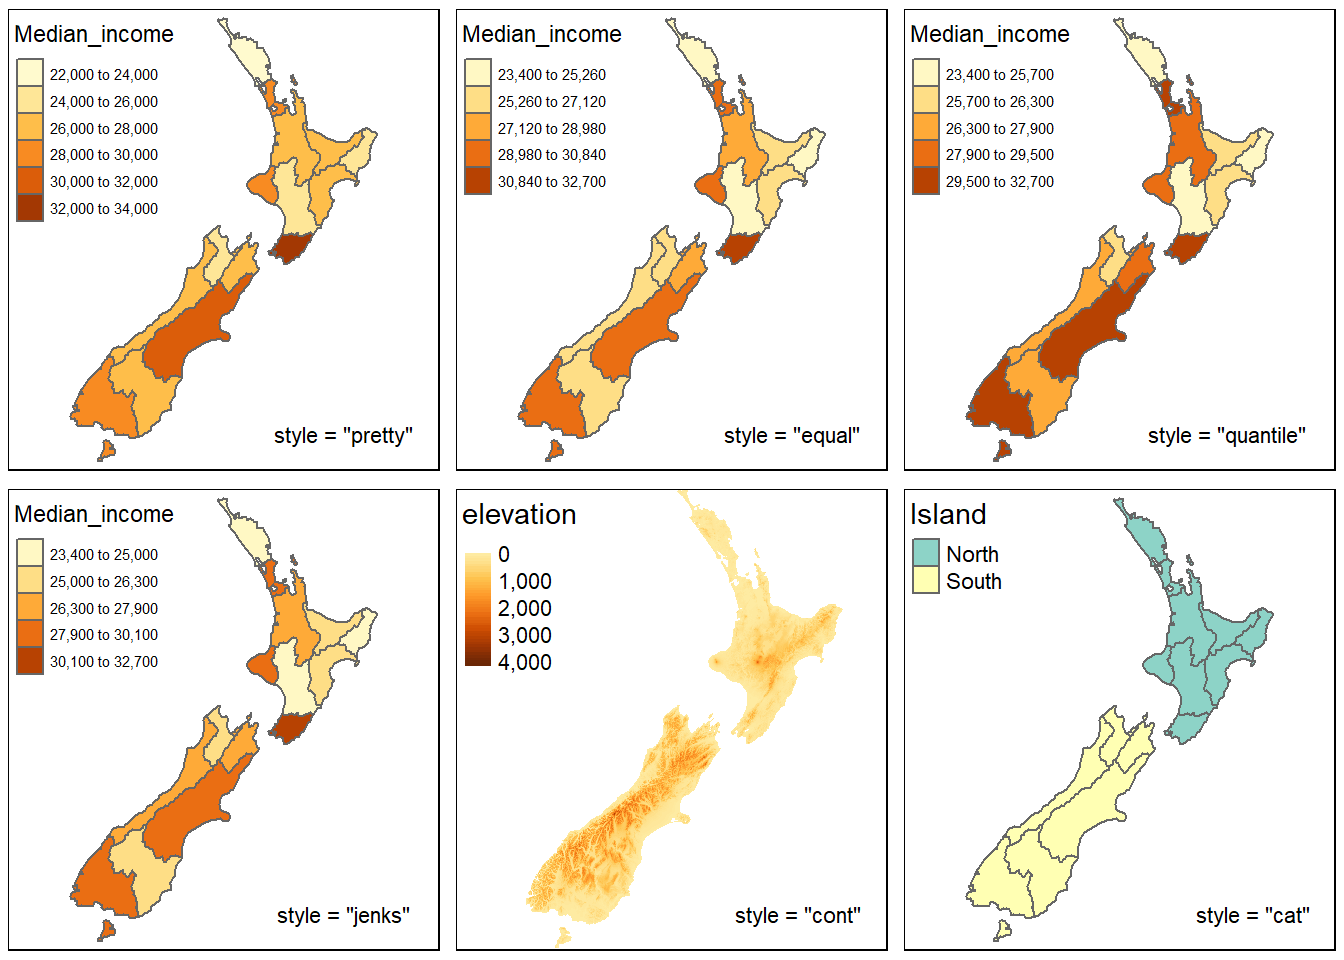
## Legend labels were too wide. The labels have been resized to 0.44, 0.29, 0.29, 0.29, 0.29. Increase legend.width (argument of tm_layout) to make the legend wider and therefore the labels larger.## Legend labels were too wide. The labels have been resized to 0.44, 0.29, 0.29, 0.29, 0.29. Increase legend.width (argument of tm_layout) to make the legend wider and therefore the labels larger.
## Legend labels were too wide. The labels have been resized to 0.44, 0.29, 0.29, 0.29, 0.29. Increase legend.width (argument of tm_layout) to make the legend wider and therefore the labels larger.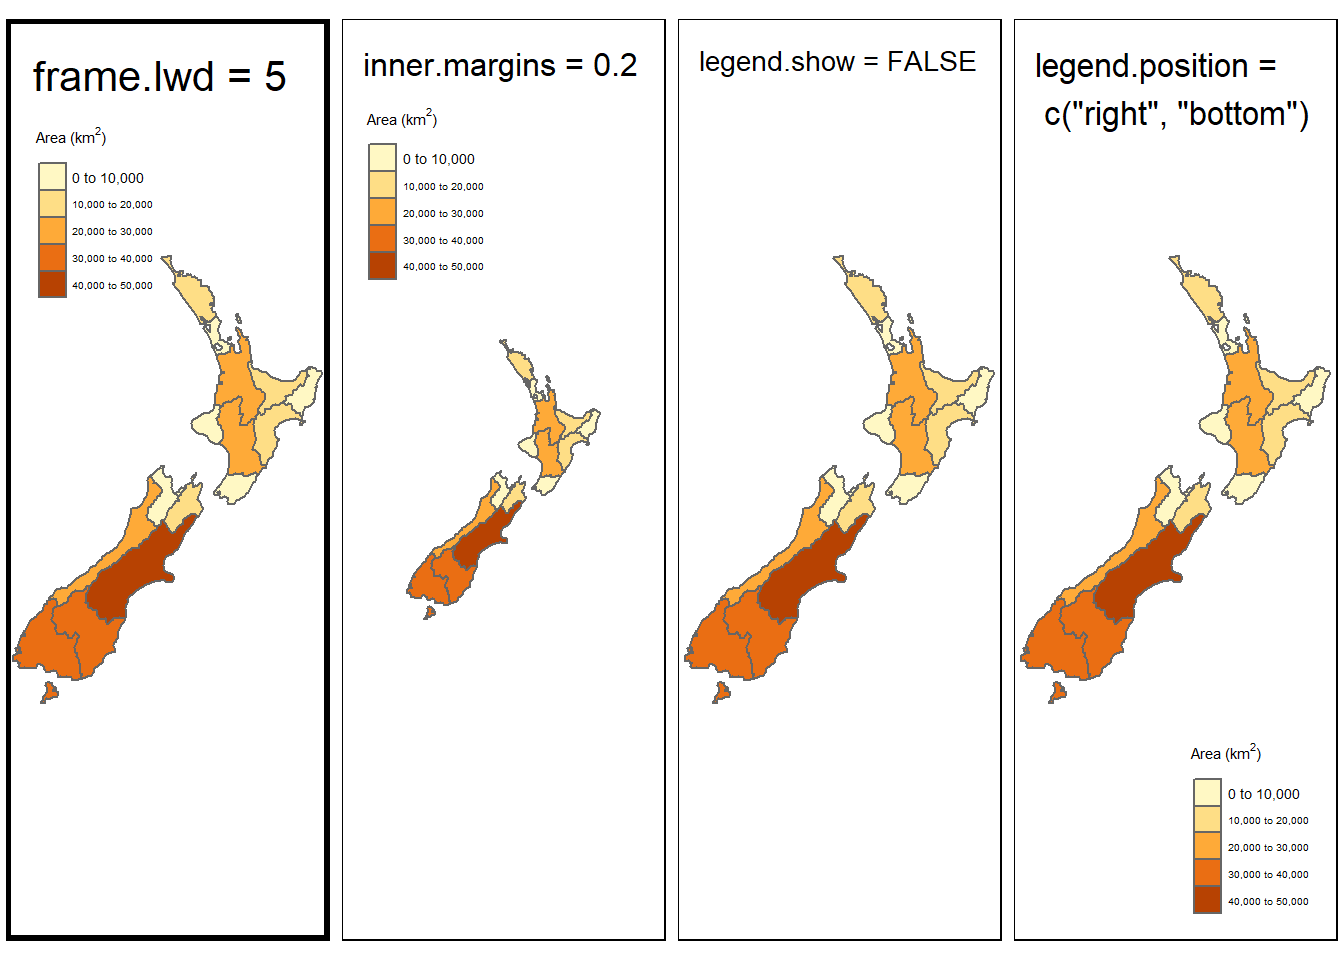
## Legend labels were too wide. The labels have been resized to 0.44, 0.29, 0.29, 0.29, 0.29. Increase legend.width (argument of tm_layout) to make the legend wider and therefore the labels larger.
## Legend labels were too wide. The labels have been resized to 0.44, 0.29, 0.29, 0.29, 0.29. Increase legend.width (argument of tm_layout) to make the legend wider and therefore the labels larger.
## Legend labels were too wide. The labels have been resized to 0.44, 0.29, 0.29, 0.29, 0.29. Increase legend.width (argument of tm_layout) to make the legend wider and therefore the labels larger.
## Legend labels were too wide. The labels have been resized to 0.44, 0.29, 0.29, 0.29, 0.29. Increase legend.width (argument of tm_layout) to make the legend wider and therefore the labels larger.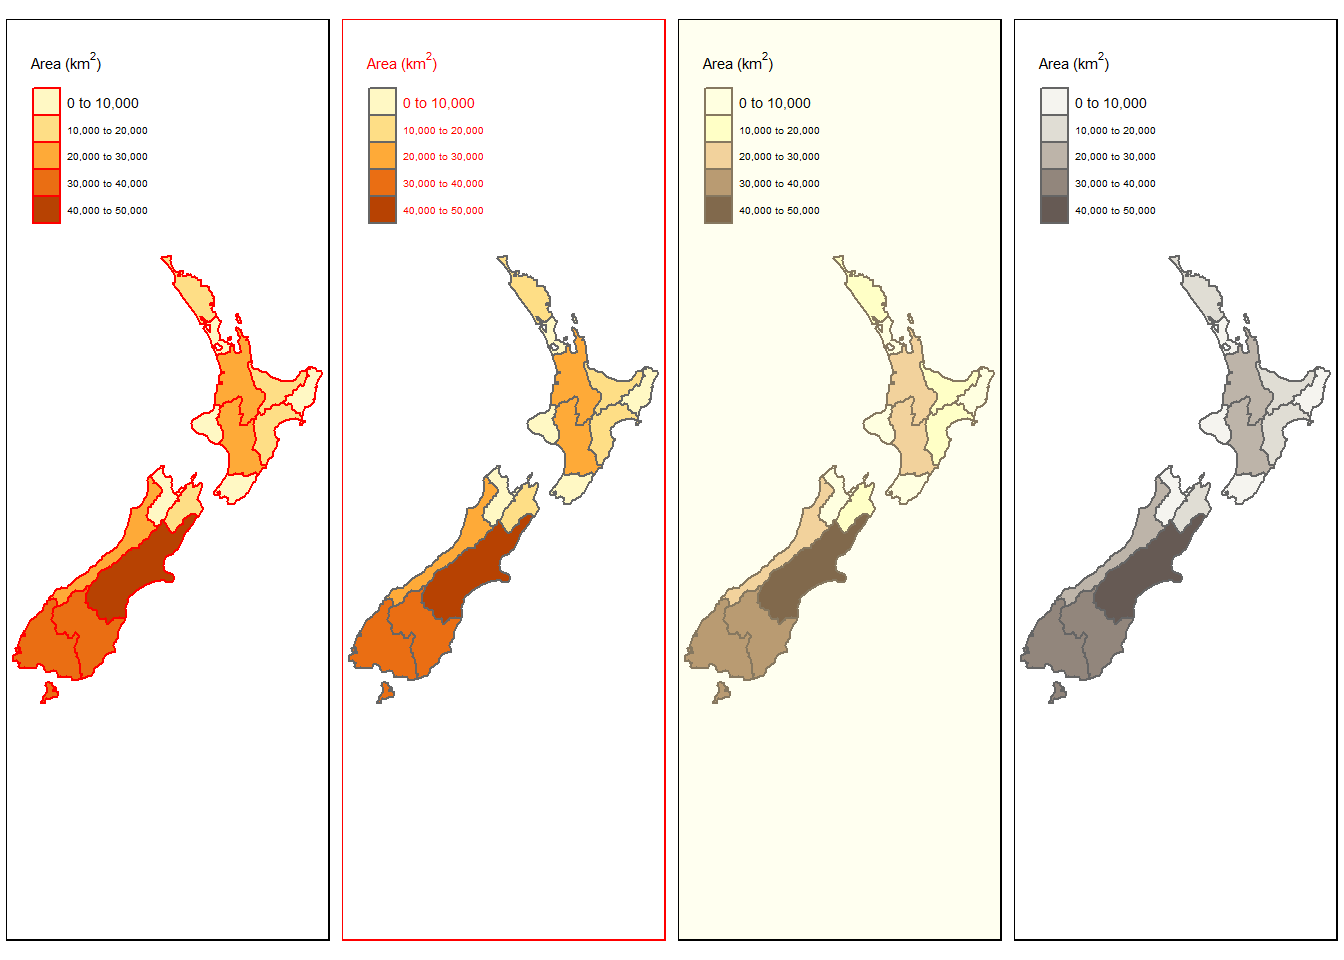
## Legend labels were too wide. The labels have been resized to 0.44, 0.29, 0.29, 0.29, 0.29. Increase legend.width (argument of tm_layout) to make the legend wider and therefore the labels larger.
## Legend labels were too wide. The labels have been resized to 0.44, 0.29, 0.29, 0.29, 0.29. Increase legend.width (argument of tm_layout) to make the legend wider and therefore the labels larger.
## Legend labels were too wide. The labels have been resized to 0.44, 0.29, 0.29, 0.29, 0.29. Increase legend.width (argument of tm_layout) to make the legend wider and therefore the labels larger.
## Legend labels were too wide. The labels have been resized to 0.44, 0.29, 0.29, 0.29, 0.29. Increase legend.width (argument of tm_layout) to make the legend wider and therefore the labels larger.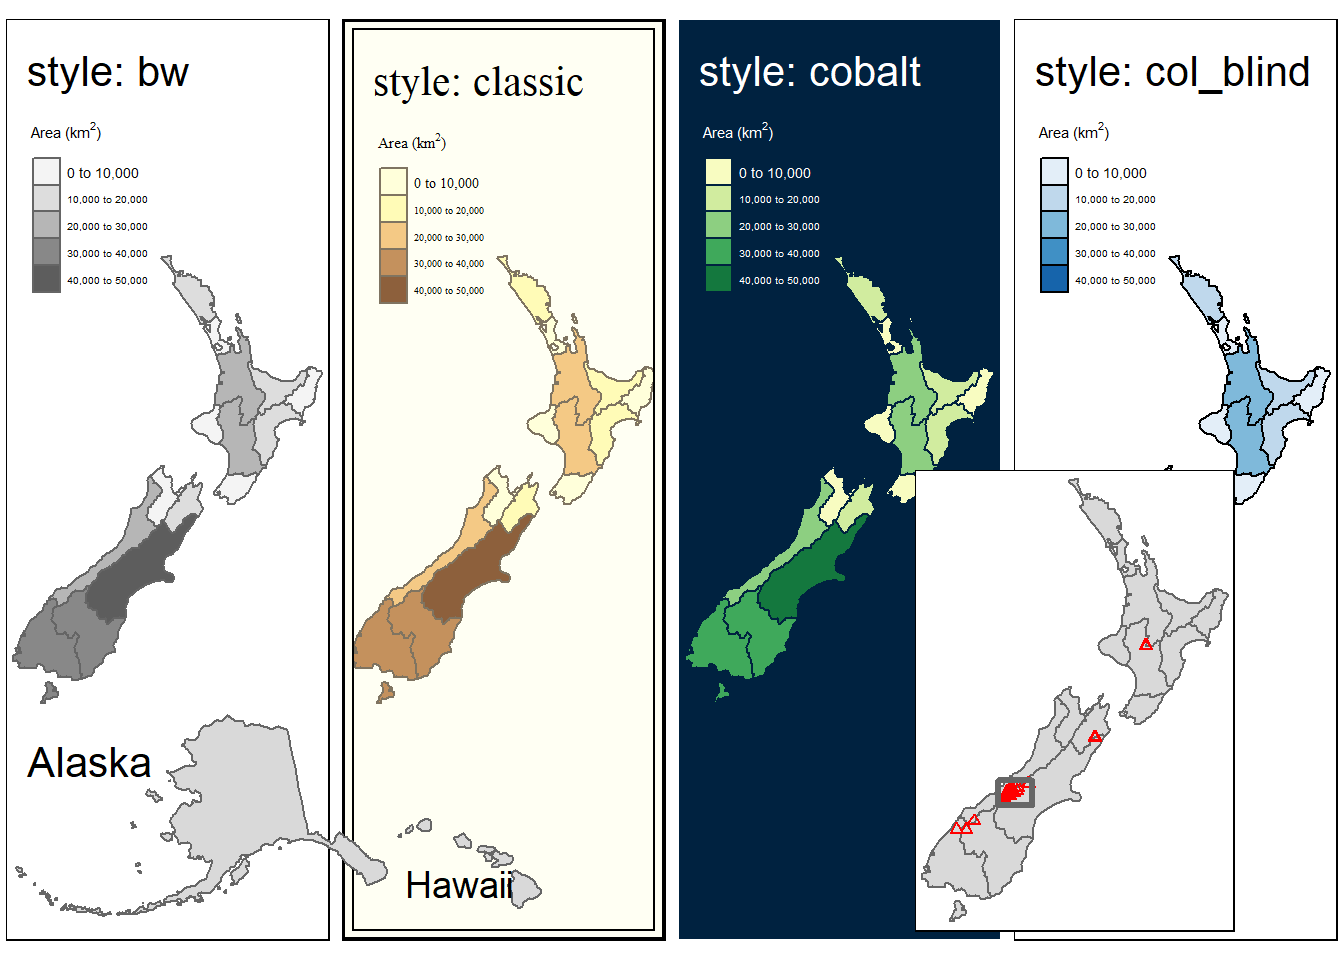
## Observations: 16
## Variables: 7
## $ Name <chr> "Northland", "Auckland", "Waikato", "Bay of Plenty", "G…
## $ Island <chr> "North", "North", "North", "North", "North", "North", "…
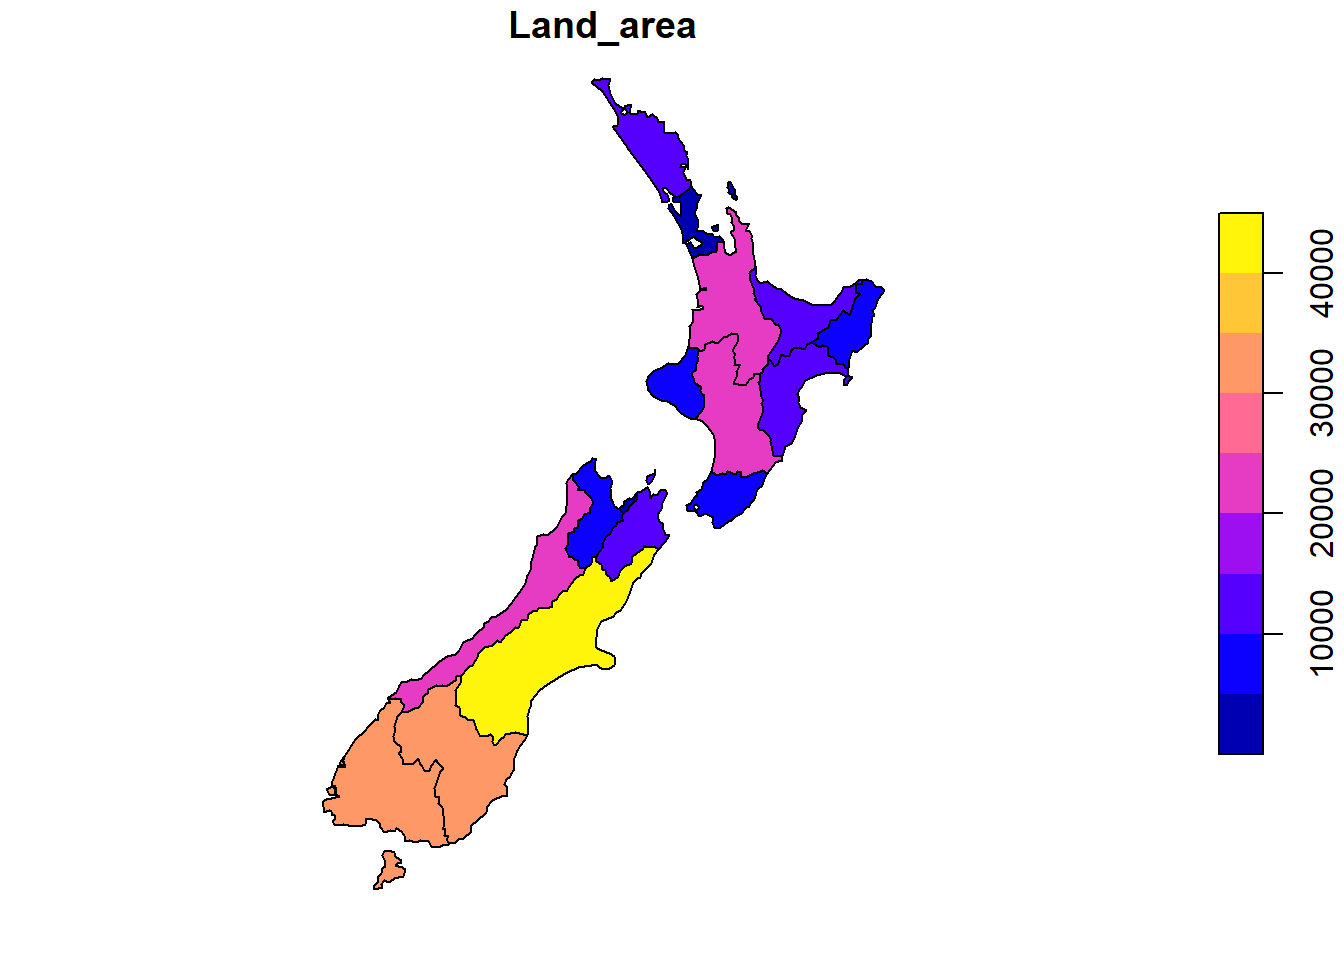
## $ Land_area <dbl> 12500.5611, 4941.5726, 23900.0364, 12071.1447, 8385.826…
## $ Population <dbl> 175500, 1657200, 460100, 299900, 48500, 164000, 118000,…
## $ Median_income <int> 23400, 29600, 27900, 26200, 24400, 26100, 29100, 25000,…
## $ Sex_ratio <dbl> 0.9424532, 0.9442858, 0.9520500, 0.9280391, 0.9349734, …
## $ geom <MULTIPOLYGON [m]> MULTIPOLYGON (((1745493 600..., MULTIPOLYG…4.2.1 First tmap attempt
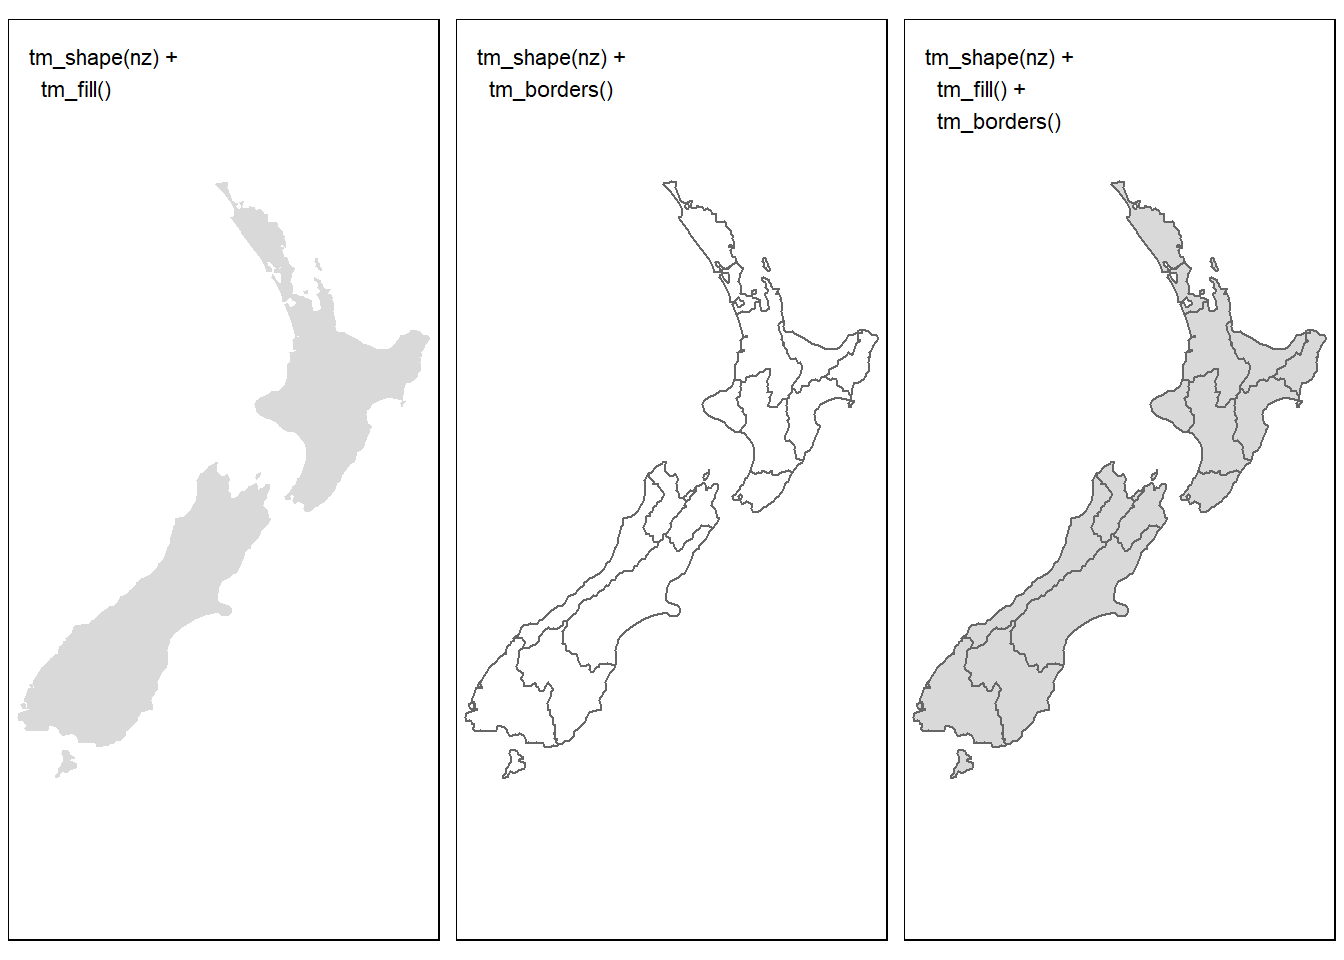
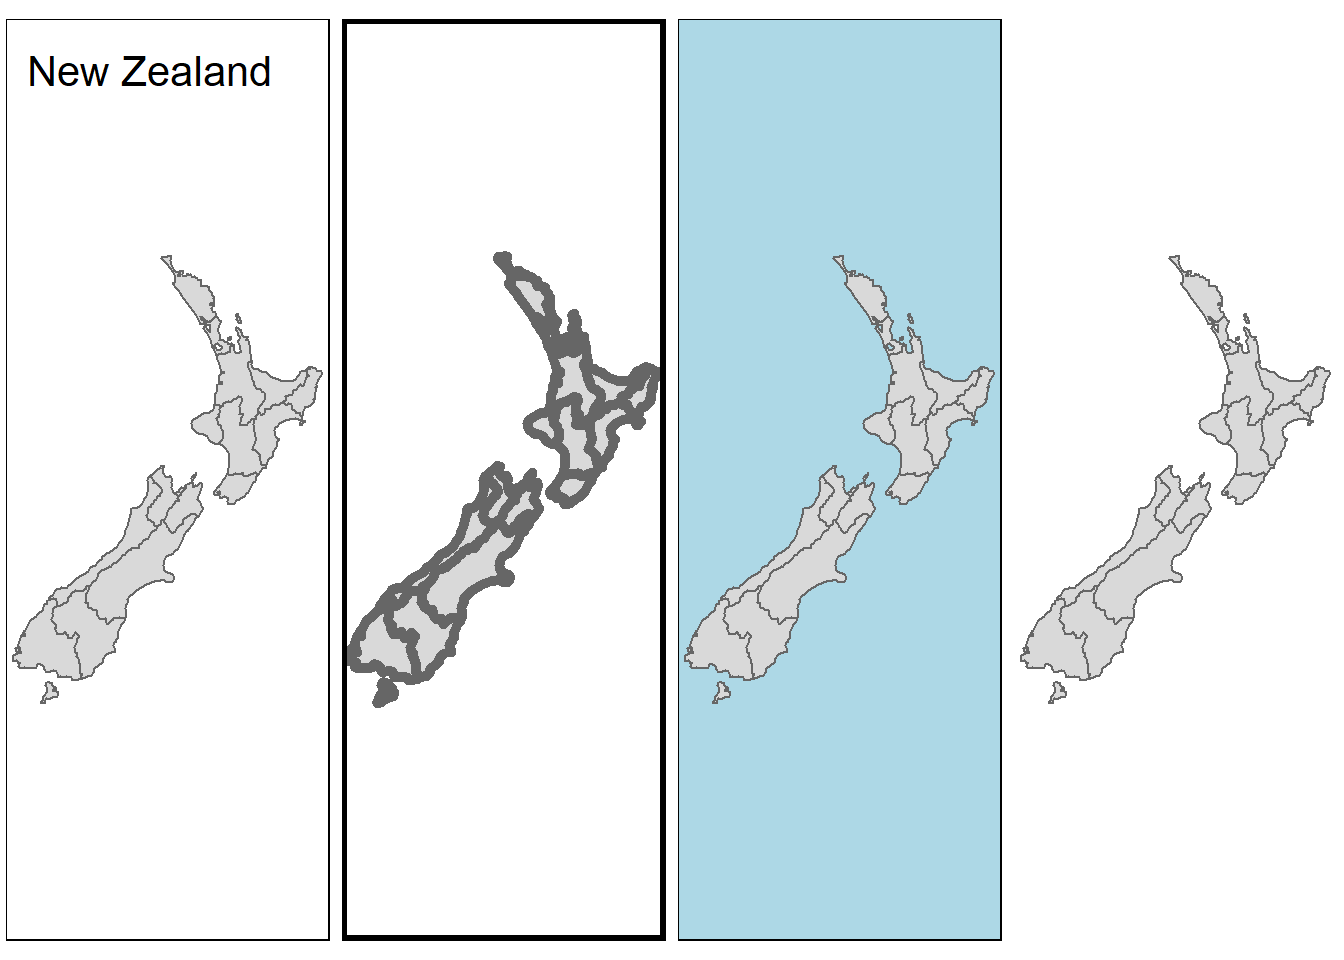
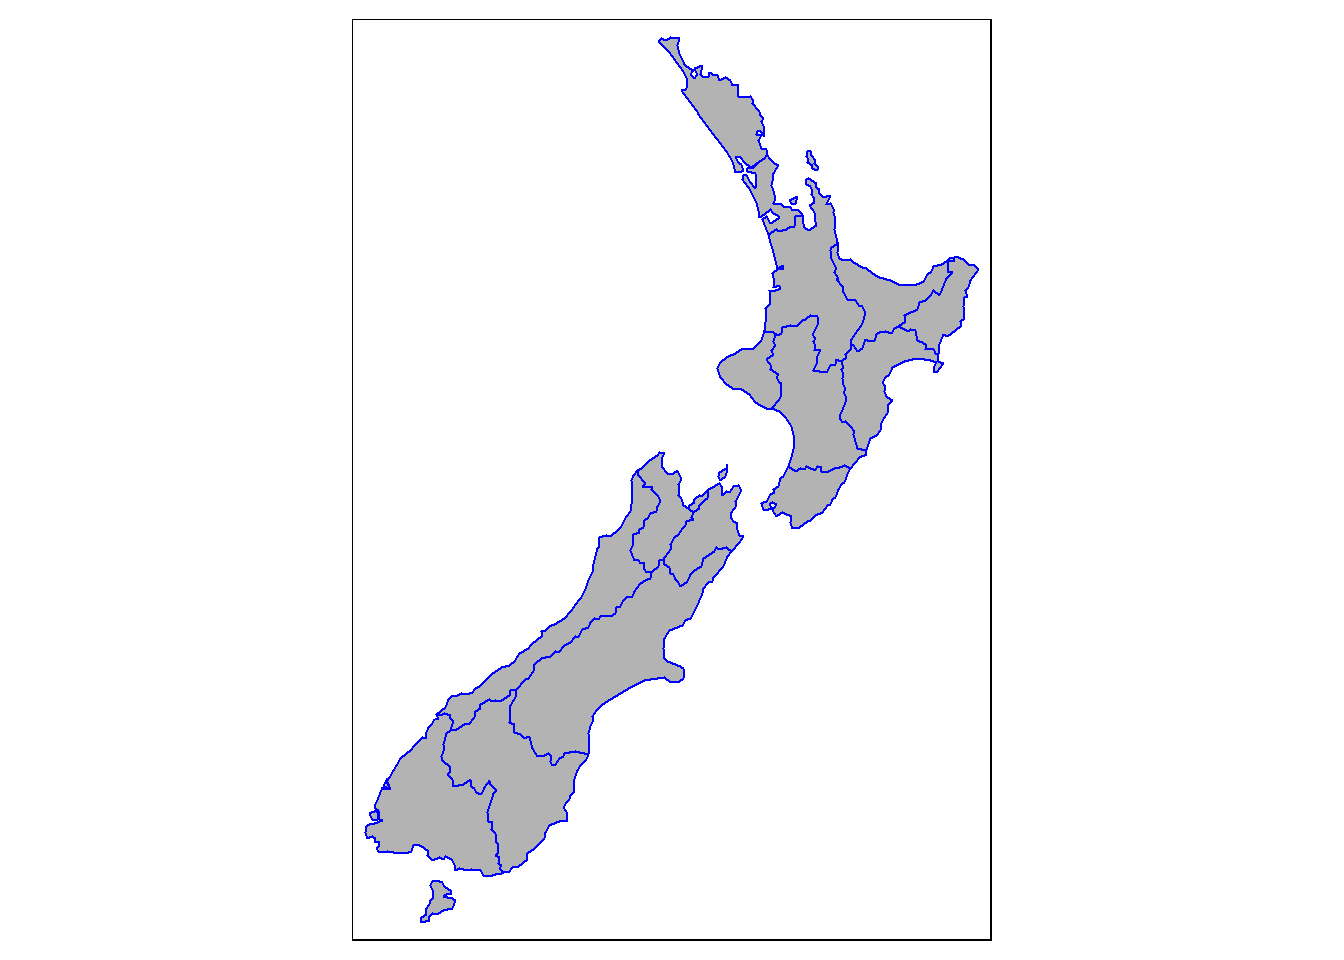
4.2.1.1 Grey background

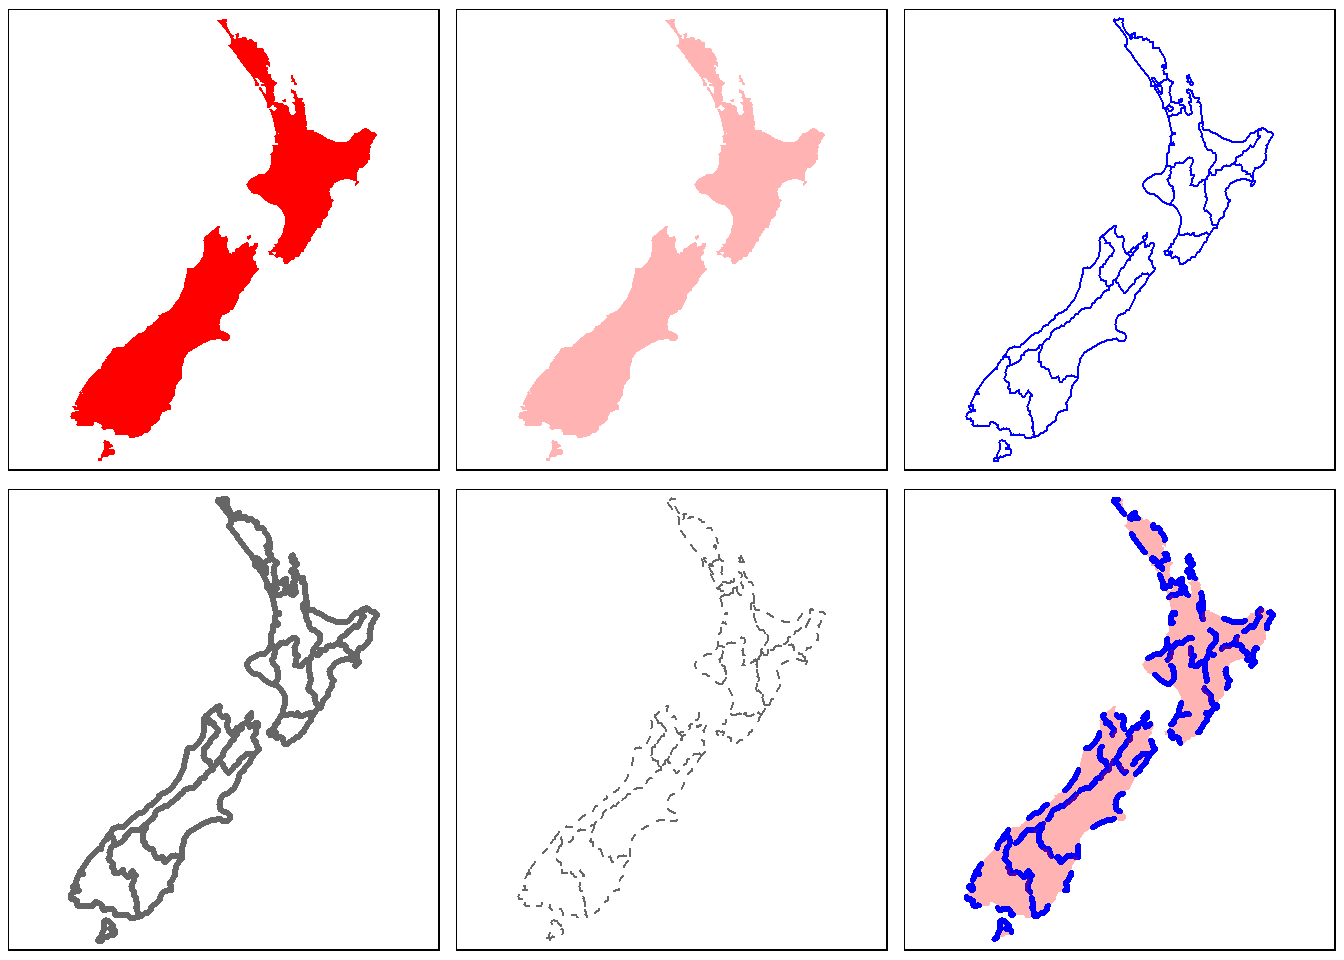
4.2.1.2 Boarders
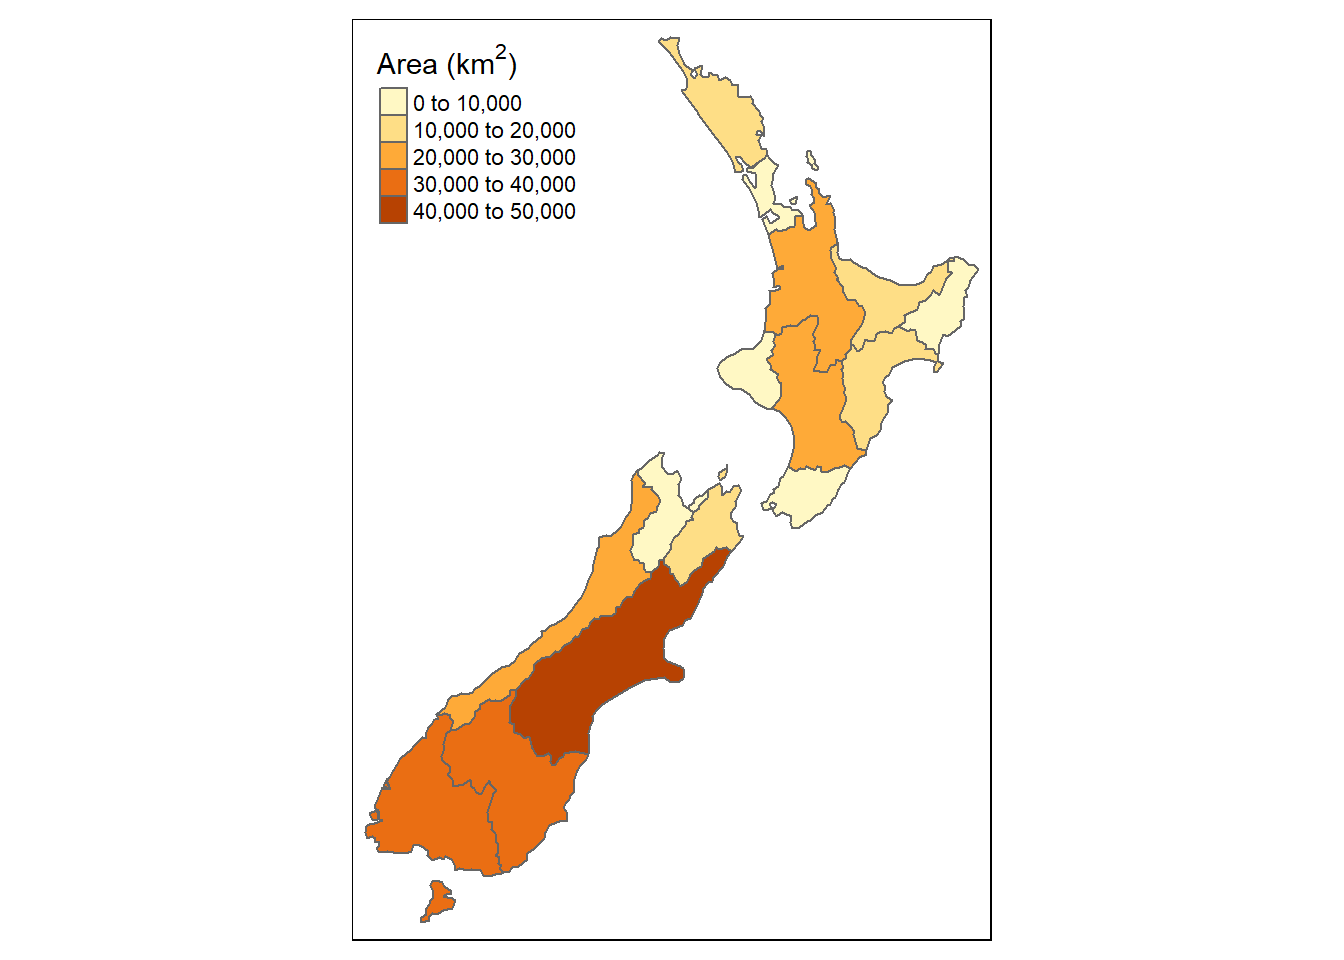
4.2.1.3 Title and legend
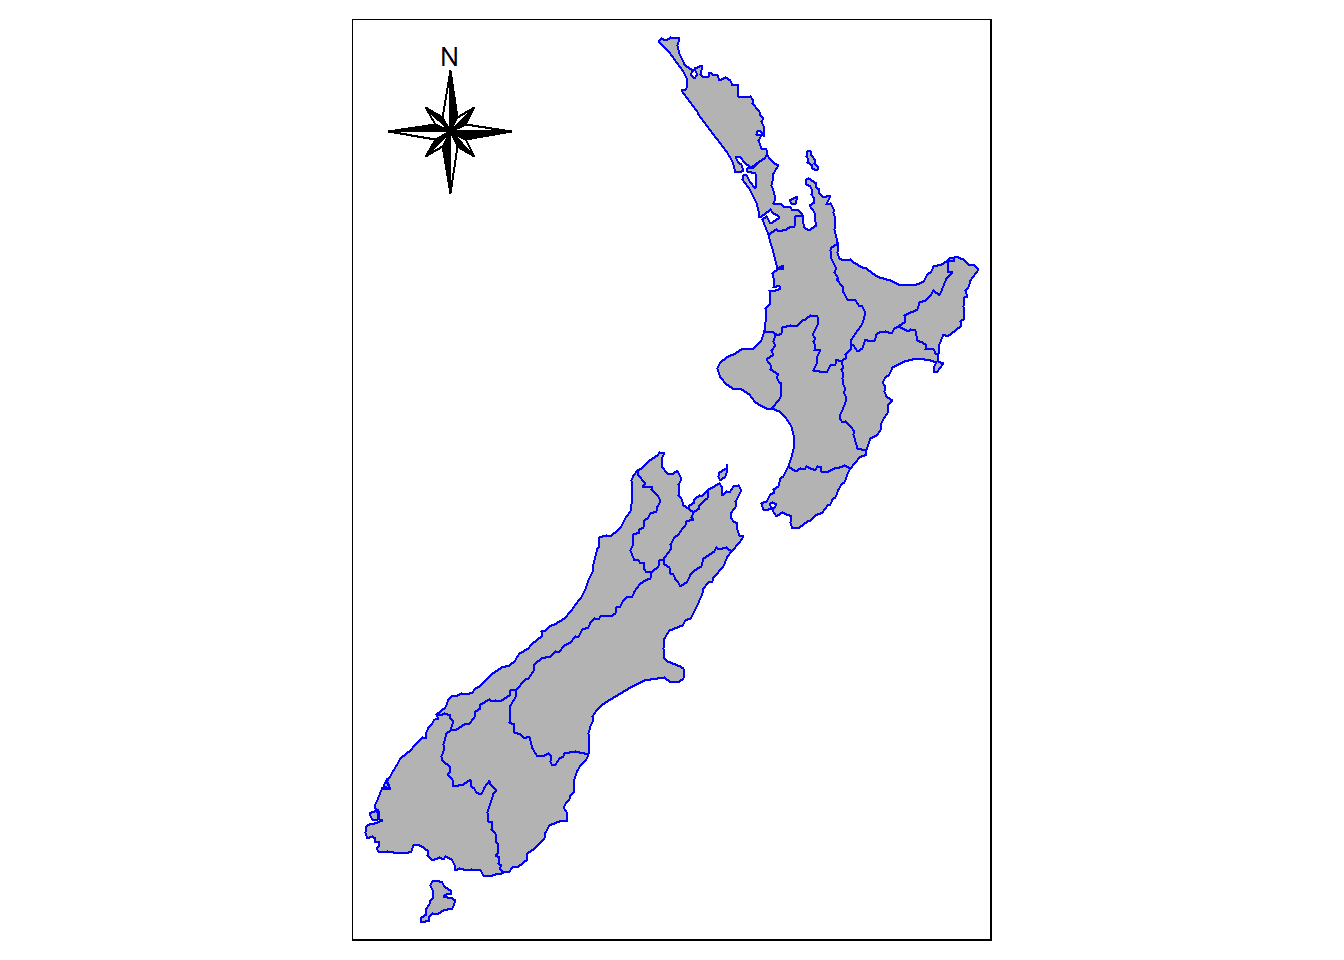
4.2.1.4 North arrow
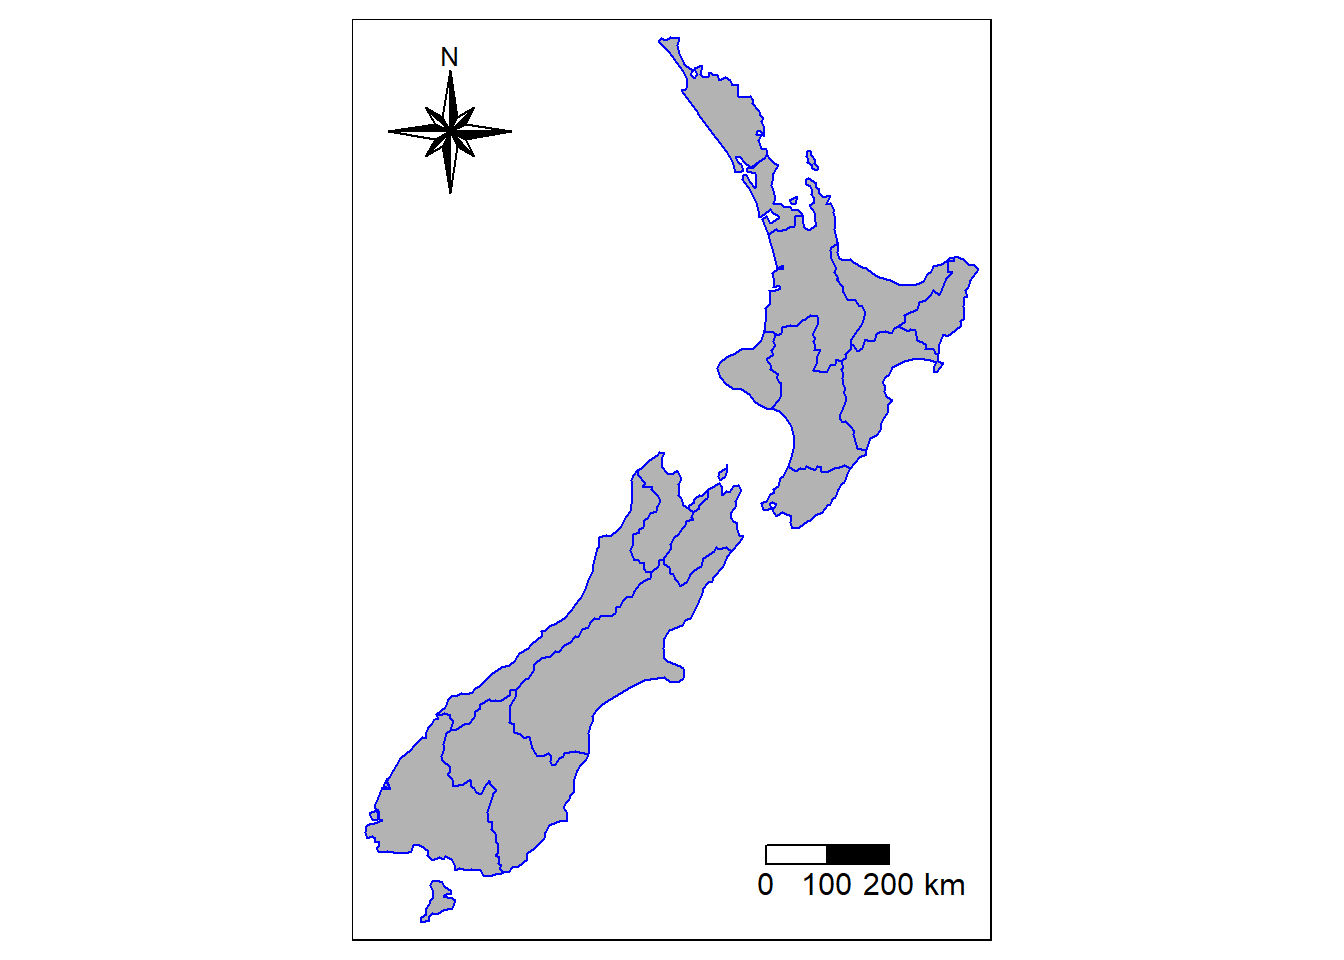
4.2.1.5 Scale
4.2.1.6 Black and white